
What a difference year-over-year makes
Monthly updates of annual rates of change are not a great way to understand the economy.
The big economic news in the United States this week was that inflation . . . well, actually, what was the news?
Certainly, you can't go wrong saying that the Bureau of Labor Statistics updated the country's official inflation data through the end of June 2023. Beyond that, I don't know how anyone makes sense of inflation based on how it is typically reported, of which these are three representative samples:
- New government figures show that inflation is easing
- U.S. inflation falls to 3%, lowest level in more than 2 years
- Inflation cools sharply in June, good news for consumers and the Fed
So there was less inflation last month, huh? Prices were going up really fast before, and now they aren't so much.
I mean, that's true, but it's not right.
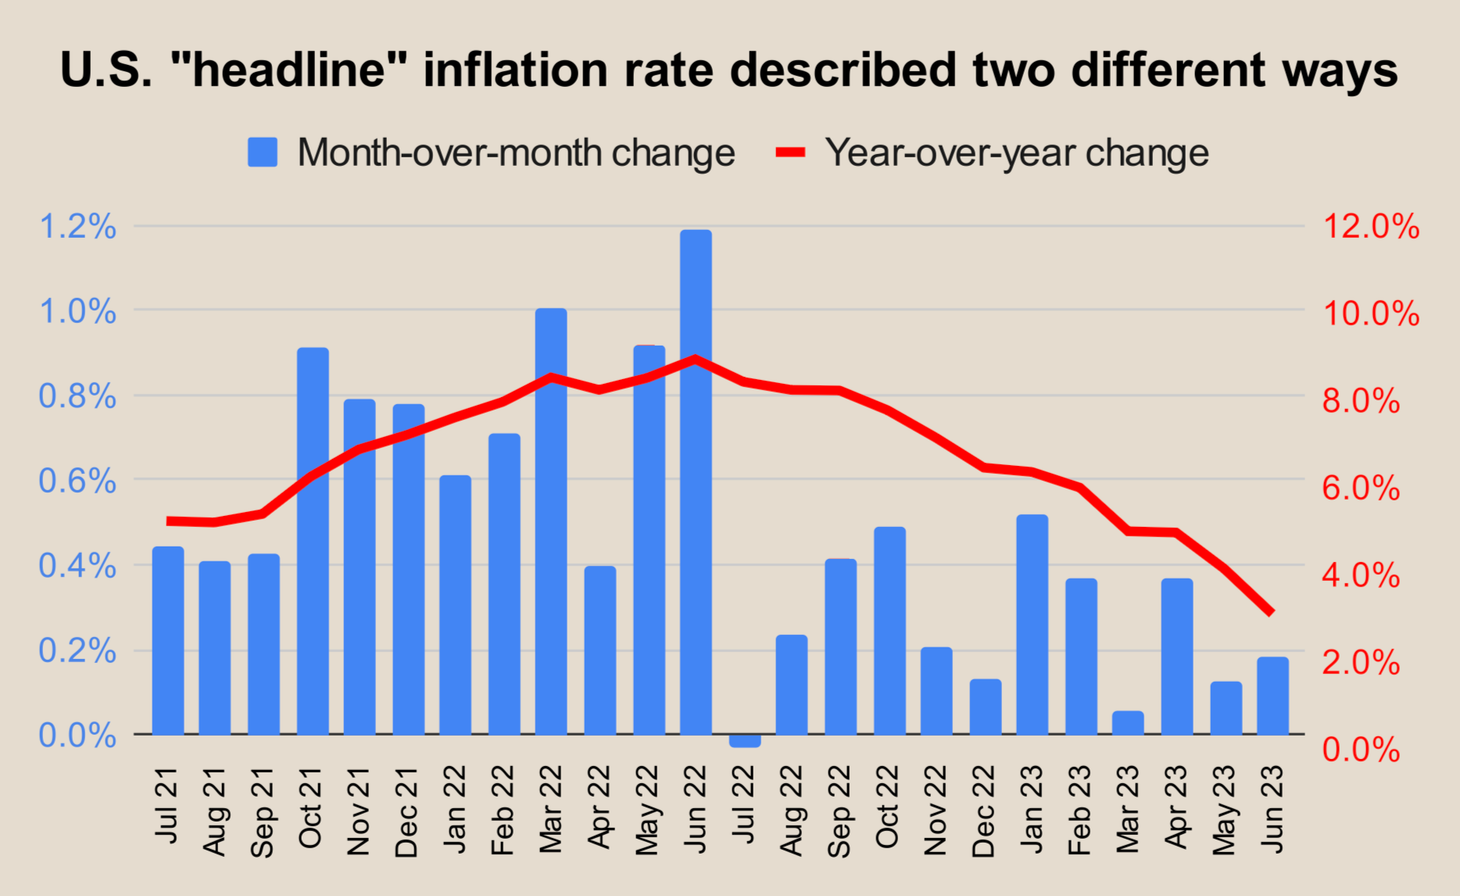
Take a look at this chart of U.S. inflation over the past two years, expressed as both the change in prices from month to month (the blue bars) and the change when compared to a year ago (the red line most often seen in news reports):

When would you say that inflation "eased", "fell", or "cooled sharply"? Last month? No, it was a whole year ago!
The challenge starts with the fact that inflation is a rate of change. Prices are usually going up, it's just a question of how fast. To answer that, you need to pick two points in time and compare them. As someone who got a C in high-school calculus, I empathize with anyone who's already lost.
When we say that inflation was 3% last month, we mean that consumer goods were 3% more expensive in June 2023 than they were a year ago. However, the standard is also to update those year-over-year figures every month. Inflation fell from 4% in May to 3% in June, we might say, and in fact most news reports do.
But, again, is that really what happened? Prices actually grew a tiny bit faster in June than in May, when you make month-over-month comparisons. (I'm intentionally ignoring other inflation nuances such as seasonal adjustments and the many flavors of inflation beyond the "headline" metric. Not the point here.)
The reality is that inflation dropped so sharply last month primarily because June 2022, when prices were really soaring, became 13 months ago instead of 12. Last month it was the point of comparison, and now it's just an old, washed-up datapoint that no longer affects how the headline inflation rate is calculated.
Of course, there are good reasons that reporters and economists don't just rely on monthly changes, either. The data are more volatile over short periods, so you can't be sure what's a blip and what's a trend. Experts look at it both ways and then some, and have debated for a while whether the inflation slowdown beginning midway through last year would persist. More data have provided confidence that it would, or rather that it did. With the hindsight of a full year, we can more confidently conclude that inflation peaked in June 2022.
It's a little absurd, though, to let the inexorable passage of time drive our analysis of economic conditions more than, say, what's happening right now. Just a few weeks ago, the New York Times was citing "high inflation and recession fears" and "continuing inflation" as counterpoints to the U.S. government's claims of having successfully controlled price growth. Anything can happen in a few weeks to alter the direction of an economy, but at that point, we already knew inflation was under control. We were just waiting for a little bit more time to pass, such that reality would show up more clearly in the year-over-year comparison.
This is a problem. People cannot be expected to understand the nuances of rates of change. They are not even good at judging prices in their own lived experience. But they can certainly grasp headlines about whether inflation is bad right now or not. And it takes a long time for perceptions of the economy to catch up with reality, so delays only compound the issue. The same newspaper that portrayed inflation as a threat in June readily accepted this week a new narrative that inflation is under control. Once again, what really changed?
The fundamental issue is a question of statistics: It's just really confusing to update a year-over-year rate of change on a monthly basis. But I'm not here to propose a different statistical method. Fixating on month-over-month changes has its own problems. Creative alternatives, like the White House's preferred metric of quarterly annualized inflation, are just more confusing.
My suggestion is that reporting on important economic data like inflation, GDP, and employment would benefit from a lot more narrative analysis and summoning the confidence to draw one's own conclusion. Look at the data with your own damn eyes and tell people what, on the whole, you make of it. (Here are two good examples of Nate DiCamillo doing this in Quartz way back in August.) Fixating on each official data release and leaning on the most widely accepted statistics is safer, but you run a high risk of being both wrong, and late to report what's right.

Read more from Zach
Sign up to receive occasional emails with new posts.